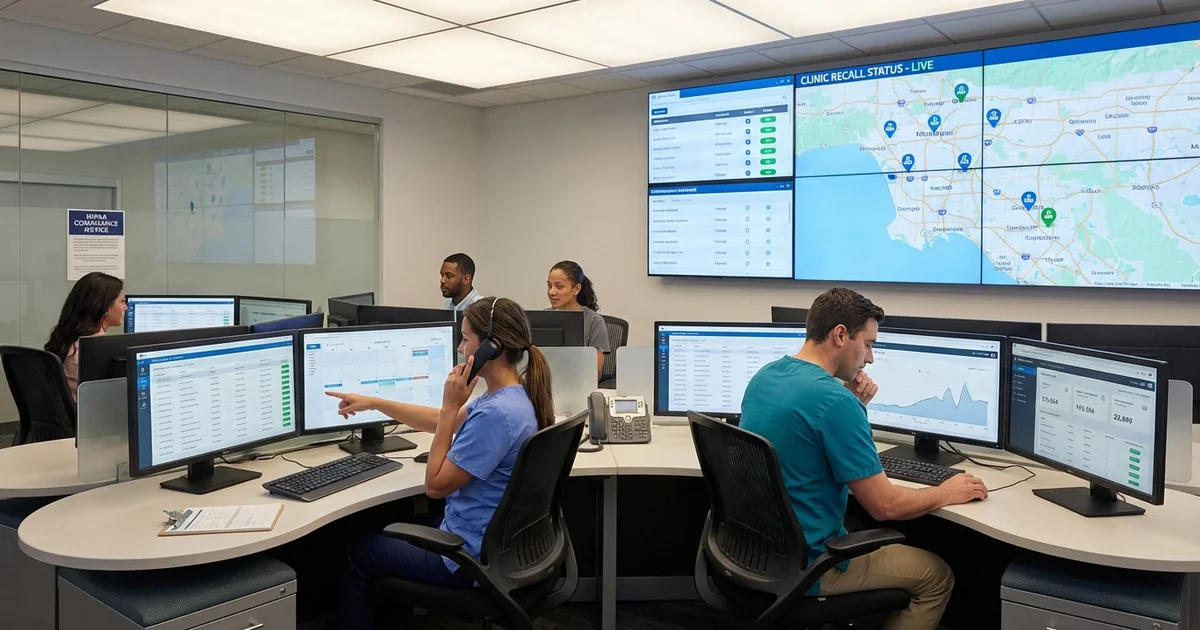
Healthcare executives frequently ask: “What is the ROI of our call center?” The answer is more complex than it appears. Unlike manufacturing where output equals input transformed, call centers generate value through multiple channels. Appointments scheduled, patients retained, revenue protected, and experiences delivered. This guide provides the comprehensive framework for calculating healthcare call center ROI at enterprise scale.
Table of Contents
- What Is the Healthcare Call Center ROI Equation?
- What Are Total Operating Costs?
- How Do You Calculate Revenue Generated?
- How Do You Quantify Revenue Protected?
- What Cost Savings Should You Include?
- What Does the Complete ROI Calculation Look Like?
- How Should You Adjust for Attribution?
- What Are the Benchmarks by Call Center Function?
- Which ROI Improvement Levers Have the Greatest Impact?
- How Should You Track and Report ROI?
What Is the Healthcare Call Center ROI Equation?
At its core, ROI measures return relative to investment:
Basic ROI Formula
ROI = (Net Benefits - Total Costs) / Total Costs x 100
For healthcare call centers, this equation expands to:
Healthcare Call Center ROI Formula
ROI = (Revenue Generated + Revenue Protected + Cost Savings - Total Operating Costs) / Total Operating Costs x 100
The three value streams:
- Revenue Generated: Direct bookings, procedure scheduling, new patient acquisition
- Revenue Protected: Patient retention, no-show recovery, reactivation
- Cost Savings: Efficiency gains, reduced front desk burden, automation
What Are Total Operating Costs?
What Are the Direct Labor Costs?
| Cost Category | Calculation | Notes |
|---|---|---|
| Agent salaries | FTE x Annual salary | Include all agents |
| Benefits and taxes | Salary x 25-35% | Health, retirement, FICA |
| Supervisor salaries | FTE x Annual salary | Typically 1:8-12 agent ratio |
| Training costs | Hours x Wage + Materials | Front-loaded in Year 1 |
| Overtime/flex | Estimated 5-10% of base | Seasonal variation |
Example calculation (20-agent center):
Direct Labor Cost Breakdown
Agent salaries: 20 x $38,000 = $760,000
Benefits (30%): $228,000
Supervisors (2): 2 x $55,000 = $110,000
Training: $30,000
Subtotal Direct Labor: $1,128,000
What Are the Technology Costs?
| Component | Typical Range | Notes |
|---|---|---|
| Phone system/VoIP | $30-75/agent/month | Cloud-based |
| Call center platform | $50-150/agent/month | ACD, routing, reporting |
| CRM/PM integration | $5,000-25,000/year | Critical for scheduling |
| Recording/QA | $10-30/agent/month | Compliance requirement |
| Reporting/analytics | $500-2,000/month | Dashboards and BI |
Example calculation:
Technology Cost Breakdown
Phone system: 20 x $50 x 12 = $12,000
Platform: 20 x $100 x 12 = $24,000
Integration: $15,000
Recording: 20 x $20 x 12 = $4,800
Reporting: $1,000 x 12 = $12,000
Subtotal Technology: $67,800
What Are the Facilities and Overhead Costs?
| Component | Calculation | Notes |
|---|---|---|
| Office space | Sq ft x Rate | 75-100 sq ft per agent |
| Utilities | Based on space | Included if co-located |
| Equipment | Desks, chairs, headsets | Amortize over 3-5 years |
| Management allocation | % of central services | HR, IT, finance support |
Example calculation:
Facilities Cost Breakdown
Office space: 2,000 sq ft x $20 = $40,000
Utilities: $6,000
Equipment (amortized): $8,000
Management allocation: $35,000
Subtotal Facilities: $89,000
Total Operating Cost: $1,284,800
How Do You Calculate Revenue Generated?
How Do You Measure Direct Appointment Revenue?
Methodology:
Appointment Revenue Formula
Appointment Revenue = Appointments Scheduled x Average Revenue per Visit x Show Rate
Tracking requirements:
- Appointments scheduled via call center (tagged in PMS)
- Revenue attributed to those appointments
- Differentiation by appointment type
Example calculation:
Direct Appointment Revenue
Monthly appointments scheduled: 2,400
Average revenue per visit: $375
Show rate: 88%
Monthly revenue: 2,400 x $375 x 0.88 = $792,000
Annual revenue: $9,504,000
How Do You Value New Patient Acquisition?
New patients generated through call center have higher lifetime value:
New Patient Value Formula
New Patient Value = New Patients x First-Year Revenue x Retention Factor x Average Tenure
Example:
New Patient Lifetime Value
New patients via call center: 150/month
First-year revenue: $650
Retention factor: 0.82
Average tenure: 5 years
Lifetime value per patient: $650 x 5 x 0.82 = $2,665
Annual new patient value: 150 x 12 x $2,665 = $4,797,000
How Does Procedure and Service Scheduling Contribute?
High-value procedures scheduled through call center:
| Procedure Type | Volume | Revenue | Total |
|---|---|---|---|
| Surgeries | 45/month | $3,200 | $1,728,000/year |
| Specialty consults | 120/month | $450 | $648,000/year |
| Diagnostic services | 200/month | $280 | $672,000/year |
How Do You Quantify Revenue Protected?
What Is the Patient Retention Value?
Patients retained through call center outreach represent protected revenue:
Retention Value Formula
Retention Value = At-Risk Patients x Intervention Success Rate x Annual Patient Value
Example calculation:
Patient Retention Value
At-risk patients identified: 500/month
Call center intervention success: 35%
Annual patient value: $520
Monthly retention value: 500 x 0.35 x $520 = $91,000
Annual retention value: $1,092,000
How Do You Calculate No-Show Recovery Value?
Revenue recovered from same-day fills and rescheduling:
No-Show Recovery Formula
Recovery Value = No-Shows x Recovery Rate x Average Visit Revenue
Example:
No-Show Recovery
Monthly no-shows: 450
Recovery rate (same-day fill): 45%
Average visit revenue: $375
Monthly recovery: 450 x 0.45 x $375 = $75,937
Annual recovery: $911,250
What Is the Reactivation Revenue Potential?
Dormant patients brought back through call center campaigns:
Reactivation Value Formula
Reactivation Value = Dormant Patients Contacted x Reactivation Rate x First-Year Revenue
Example:
Reactivation Revenue
Monthly reactivation calls: 1,200
Reactivation rate: 22%
Average first-year revenue: $580
Monthly reactivation revenue: 1,200 x 0.22 x $580 = $153,120
Annual reactivation revenue: $1,837,440
What Cost Savings Should You Include?
How Do You Measure Front Desk Efficiency Savings?
Call center relieving front desk burden:
Front Desk Efficiency Formula
Efficiency Savings = Calls Redirected x Time per Call x Blended Hourly Rate
Example:
Front Desk Efficiency Savings
Calls handled by call center (not front desk): 4,500/month
Average time per call: 4.5 minutes
Front desk blended rate: $22/hour
Monthly savings: 4,500 x 0.075 hours x $22 = $7,425
Annual savings: $89,100
What Is the Appointment Optimization Value?
Reduced gaps and improved scheduling efficiency:
Appointment Optimization Formula
Optimization Value = Additional Appointments Fit x Average Revenue
Example:
Appointment Optimization
Additional appointments per month (through better scheduling): 180
Average revenue: $375
Monthly optimization: 180 x $375 = $67,500
Annual optimization: $810,000
How Much Can Self-Service Deflection Save?
Calls handled through IVR or automation:
Self-Service Deflection Formula
Deflection Savings = Self-Service Transactions x Average Call Cost
Example:
Self-Service Deflection Savings
Monthly self-service transactions: 3,200
Average call cost: $8.50
Monthly savings: 3,200 x $8.50 = $27,200
Annual savings: $326,400
What Does the Complete ROI Calculation Look Like?
Bringing together all components:
Revenue Generated:
Revenue Generated
Direct appointments: $9,504,000
New patient value: $4,797,000
Procedure scheduling: $3,048,000
Subtotal Generated: $17,349,000
Revenue Protected:
Revenue Protected
Retention value: $1,092,000
No-show recovery: $911,250
Reactivation: $1,837,440
Subtotal Protected: $3,840,690
Cost Savings:
Cost Savings
Front desk efficiency: $89,100
Appointment optimization: $810,000
Self-service deflection: $326,400
Subtotal Savings: $1,225,500
Total Benefits: $22,415,190
Total Costs: $1,284,800
Net Benefits: $21,130,390
Complete ROI Result
ROI: ($21,130,390 / $1,284,800) x 100 = 1,644%
How Should You Adjust for Attribution?
The 1,644% ROI above assumes full attribution, which overstates reality. Adjustments are needed:
What Does a Conservative Attribution Model Look Like?
Not all value is directly attributable to call center:
| Value Stream | Full Value | Attribution % | Adjusted Value |
|---|---|---|---|
| Direct appointments | $9,504,000 | 100% | $9,504,000 |
| New patient value | $4,797,000 | 40% | $1,918,800 |
| Procedure scheduling | $3,048,000 | 80% | $2,438,400 |
| Retention value | $1,092,000 | 60% | $655,200 |
| No-show recovery | $911,250 | 90% | $820,125 |
| Reactivation | $1,837,440 | 85% | $1,561,824 |
| Cost savings | $1,225,500 | 80% | $980,400 |
Adjusted Total Benefits: $17,878,749
Conservative ROI: ($17,878,749 - $1,284,800) / $1,284,800 x 100 = 1,291%
Even with conservative attribution, healthcare call centers typically show 40-200%+ ROI in well-run operations.
What Are the Benchmarks by Call Center Function?
Scheduling-Focused Call Center
| Metric | Benchmark | Top Quartile |
|---|---|---|
| Appointments scheduled/agent/day | 25-35 | 40+ |
| Conversion rate (call to appointment) | 65-75% | 80%+ |
| Average handle time | 4-6 min | <4 min |
| Cost per appointment | $12-20 | <$10 |
| ROI (scheduling only) | 80-150% | 200%+ |
Patient Retention Call Center
| Metric | Benchmark | Top Quartile |
|---|---|---|
| Contact rate | 40-55% | 60%+ |
| Reactivation rate | 18-25% | 30%+ |
| Retention intervention success | 30-40% | 50%+ |
| Cost per retained patient | $25-50 | <$20 |
| ROI (retention only) | 100-200% | 400%+ |
Full-Service Call Center
| Metric | Benchmark | Top Quartile |
|---|---|---|
| First call resolution | 70-80% | 85%+ |
| Patient satisfaction (CSAT) | 80-88% | 92%+ |
| Agent utilization | 70-80% | 82-85% |
| Cost per call | $7-12 | <$6 |
| Overall ROI | 100-300% | 500%+ |
Which ROI Improvement Levers Have the Greatest Impact?
Lever 1: Increase Conversion Rate
Impact: 10% improvement in call-to-appointment conversion
Before
- 65% conversion x 1,000 calls
- = 650 appointments
After
- 75% conversion x 1,000 calls
- = 750 appointments
- Additional revenue: 100 x $375 = $37,500/month = $450,000/year
Lever 2: Reduce Average Handle Time
Impact: 1-minute reduction in AHT
Before
- Calls per day per agent: 45
After
- Calls per day per agent: 52 (+7)
- Additional capacity: 7 x 20 agents x 22 days = 3,080 calls/month
- Value: 3,080 x 0.70 x $375 = $808,500/month
Lever 3: Improve Retention Success Rate
Impact: 10% improvement in retention intervention success
Before
- At-risk patients: 500/month
- 35% success = 175 retained
After
- 45% success = 225 retained
- Additional: 50 x $520 = $26,000/month = $312,000/year
How Should You Track and Report ROI?
Weekly ROI Metrics
| Metric | Target | Notes |
|---|---|---|
| Appointments scheduled | By agent/team | Primary productivity |
| Revenue booked | Total and per agent | Direct value |
| Contact rate | By campaign | Outreach effectiveness |
| Conversion rate | By call type | Quality measure |
| Cost per appointment | Week over week | Efficiency trend |
Monthly ROI Report
| Category | This Month | YTD | vs. Budget |
|---|---|---|---|
| Total calls handled | |||
| Appointments scheduled | |||
| Revenue generated | |||
| Revenue protected | |||
| Cost savings | |||
| Total operating cost | |||
| ROI |
Quarterly Business Review
- Year-over-year comparison
- Cost trends analysis
- Revenue attribution review
- Benchmark comparison (internal and external)
- ROI improvement initiatives
- Technology investment recommendations
Key Takeaways
Healthcare call center ROI calculation requires comprehensive analysis:
Cost components:
- Direct labor (60-70% of total)
- Technology (5-10%)
- Facilities and overhead (15-25%)
Revenue streams:
- Direct appointment scheduling (largest component)
- Patient retention and reactivation
- No-show recovery
- New patient acquisition
Typical ROI ranges:
- Scheduling-focused: 80-200%
- Retention-focused: 100-400%
- Full-service: 100-500%+
Improvement levers:
- Conversion rate optimization
- Handle time efficiency
- Retention success rate
- Self-service deflection
The healthcare call center is not a cost center. It is a revenue and retention engine that, when measured properly, demonstrates substantial positive ROI.
For implementation of centralized call center operations, see our centralized patient recall guide. For the impact on EBITDA, review our multi-location healthcare EBITDA guide. Multi-location healthcare groups need standardized intake across every site. Talk to our team about how MyBCAT provides centralized call answering and patient access for growing organizations.