A regional optometry group was growing fast but losing patients to unanswered calls. With private equity interest on the horizon, they needed operational excellence. Here is how they transformed their intake operations and the measurable impact on revenue.
Table of Contents
- What Was the Challenge Before PE?
- What Solution Did They Implement?
- What Were the Results After 6 Months?
- What Changed Day-to-Day Beyond the Numbers?
- What Are the Key Lessons for Other Optometry Groups?
- Is This Approach Right for Your Group?
What Was the Challenge Before PE?
Company profile: 8 locations across 2 states. $12M annual revenue. 52 employees including 10 front desk staff. Organic growth with PE partnership exploration.
The group had built a strong clinical reputation. Patients loved their doctors. But operational cracks were showing.
The problems:
Missed calls were mounting. With 10 front desk staff spread across 8 locations, coverage was inconsistent. When a location got busy, calls went to voicemail. They estimated 35+ missed calls daily across the group.
Clinical and retail calls got tangled. Optometry has a unique challenge: some callers need clinical exams, others want to buy glasses, and many need both. Staff were not equipped to route efficiently, leading to long calls and frustrated patients.
VSP verification consumed resources. Vision insurance verification took 8-10 minutes per call. These calls clogged phone lines during peak hours, causing other calls to go unanswered.
Spanish-speaking patients struggled. With 25% of patients preferring Spanish, limited bilingual staff created barriers.
PE due diligence was approaching. The leadership knew that operational metrics would be scrutinized. Answer rate, patient conversion, and capture rate all needed improvement.
What Solution Did They Implement?
After evaluating several options, the group implemented MyBCAT across all 8 locations with these key components:
How Did Custom Clinical-Retail Routing Work?
The first step was solving the optometry-specific routing challenge. Calls were classified within 15 seconds:
Clinical appointment requests → scheduling team. Optical inquiries (frames, contacts) → optical specialists. Insurance verification → dedicated verification queue. Hybrid needs → appropriate primary handler with warm transfer capability.
This reduced average call time while improving first-call resolution.
How Was VSP and Insurance Streamlined?
Insurance verification was moved off the main phone lines:
Online verification tools became primary method. Pre-appointment verification batched during off-peak hours. Dedicated verification specialists for complex cases. Reduced verification call time from 8 minutes to 3 minutes average.
How Was Bilingual Support Added?
Spanish-language capability was added without hiring additional staff:
Spanish-speaking callers identified and routed appropriately. Full scheduling and optical support in Spanish. Insurance verification available in Spanish. No more relying on which location happened to have a bilingual employee working.
How Did Peak Hour Overflow Change?
Instead of calls going to voicemail during busy periods:
Overflow routing activated automatically based on wait times. Calls handled to completion, not just messages taken. Real-time scheduling access across all locations. Smooth experience regardless of call volume.
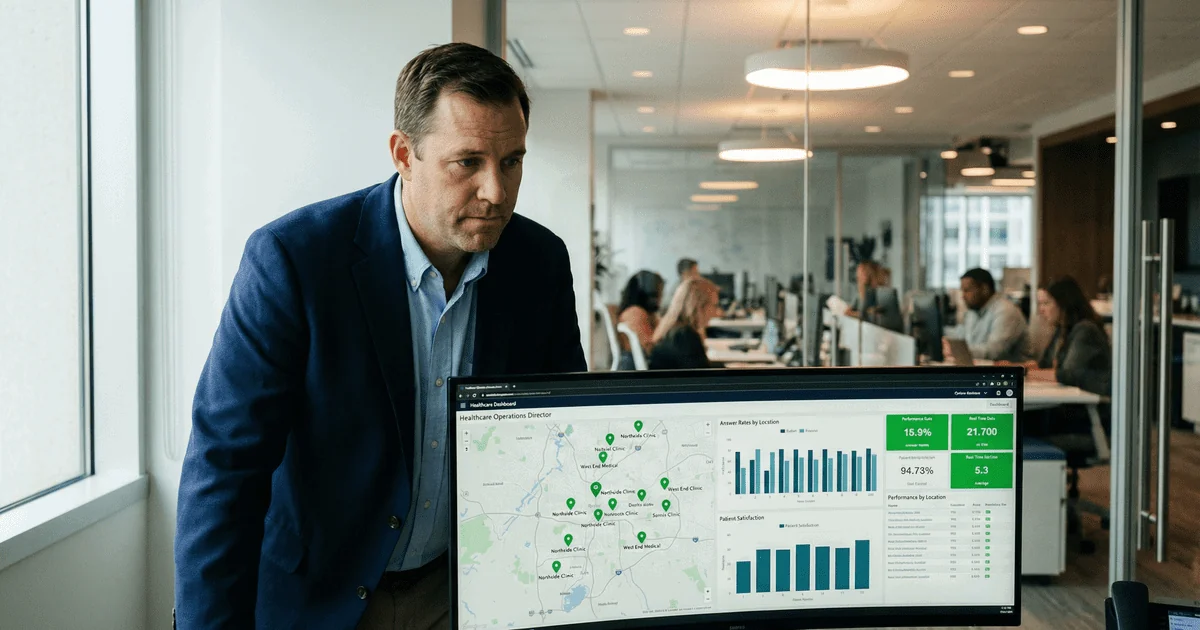
What Did the Unified Dashboard Provide?
Leadership gained visibility into operations:
Real-time call metrics by location. Answer rate tracking. Average handling time. Optical opportunity flagging. Patient satisfaction indicators.
What Were the Results After 6 Months?
How Did Call Performance Improve?
| Metric | Before | After | Change |
|---|---|---|---|
| Call Answer Rate | 72% | 95% | +32% improvement |
| Missed Calls (Daily) | 35 | 6 | -83% reduction |
| Average Wait Time | 45 seconds | 12 seconds | -73% reduction |
| Average Handle Time | 4.2 minutes | 3.1 minutes | -26% reduction |
The improvement was immediate and sustained. By month 3, answer rate had stabilized above 94%.
How Did Patient Conversion Change?
| Metric | Before | After | Change |
|---|---|---|---|
| New Patient Conversion | 58% | 74% | +28% increase |
| Appointment Show Rate | 82% | 89% | +9% increase |
| Same-Day Scheduling | 34% | 52% | +53% increase |
When patients could reach the practice easily, they booked. When confirmations and reminders were consistent, they showed up.
How Did Optical Performance Improve?
| Metric | Before | After | Change |
|---|---|---|---|
| Optical Inquiry Routing Accuracy | 45% | 92% | +104% improvement |
| Capture Rate | 52% | 61% | +17% increase |
| Pre-Scheduled Dispensary Appointments | 18% | 41% | +128% increase |
This was the unexpected win. By routing optical inquiries correctly and proactively scheduling dispensary time during exam bookings, capture rate improved dramatically.
What Was the Revenue Impact?
The math:
Additional new patients per month: 82. Average new patient lifetime value: $800. Monthly revenue increase: $65,600. Annual revenue increase: $787,200.
The capture rate improvement added further revenue not included in this calculation.
ROI: The investment paid for itself within the first 8 weeks.
What Changed Day-to-Day Beyond the Numbers?
For Front Desk Staff
“I used to dread the afternoon rush. Phones ringing, patients checking out, and I knew calls were going to voicemail. Now I can focus on the patients in front of me knowing the phones are covered.”
- Front Desk Manager, Location 4
Staff reported lower stress levels across all locations. Front desk turnover, which had been 40% annually, dropped to under 15%.
For Optical Staff
“We used to get patients who came in for exams with no idea we had an optical department. Now they show up asking about the frames they discussed on the phone.”
- Lead Optician, Location 2
Optical staff received better-prepared patients. Pre-scheduling dispensary time meant patients arrived with time allocated for frame selection rather than rushing after an exam.
For Practice Leadership
“For the first time, I can see what is happening across all locations in real-time. When location 6 had a staffing issue last month, I saw the call metrics dip immediately and we could respond.”
- Director of Operations
Visibility enabled proactive management rather than reactive firefighting.
For the PE Process
“Our operational metrics went from a weakness to a strength in due diligence. The answer rate and conversion data showed we had scalable systems.”
- CEO
The PE firm specifically cited operational improvements as a factor in their valuation. The partnership closed 6 months after implementation.
What Are the Key Lessons for Other Optometry Groups?
1. Answer Rate Directly Impacts Revenue
The correlation was clear: more answered calls meant more scheduled appointments meant more revenue. Every missed call represented potential lost revenue.
2. Optometry Requires Specialized Routing
Generic answering services do not understand the clinical-retail dynamic. Solutions must distinguish between exam requests, optical inquiries, and hybrid needs.
3. Capture Rate Starts at Intake
Optical revenue improved not through sales training but through intake changes. Setting expectations during scheduling dramatically affected in-office behavior.
4. Insurance Verification Is a Capacity Problem
Moving VSP verification off the main lines freed substantial capacity for revenue-generating calls.
5. Visibility Enables Improvement
You cannot improve what you cannot see. Real-time metrics across locations made problems visible and solutions measurable.
Is This Approach Right for Your Group?
This case study reflects results for a specific group with specific challenges. Your situation may differ. However, the underlying principles apply broadly:
Good candidates for this approach: Multi-location optometry groups (4+ locations). Groups experiencing answer rate below 85%. Groups with significant optical revenue opportunity. Groups preparing for growth or transactions. Groups with inconsistent coverage across locations.
Signals that intake optimization could help:
- You do not know your current answer rate
- Patients complain about reaching the office
- Voicemail boxes fill up regularly
- Front desk staff seem overwhelmed
- Capture rate is stagnant despite marketing investment
Want to understand the clinical-retail routing framework in detail? Read our complete Optometry Intake Guide.
Curious about the financial model? Use our EBITDA Impact Calculator to estimate potential returns for your group.
Last Updated: January 2026
Sources: MGMA Workforce Survey, CallRail Healthcare Marketing Challenges
The operational foundation of a successful optometry practice extends beyond clinical excellence. Practices that track their key performance indicators consistently outperform those that rely on intuition alone. Metrics like patient conversion rate, average revenue per visit, optical capture rate, and recall compliance rate provide the data needed to make informed decisions. When these numbers are visible to the entire team, accountability improves naturally. Staff members who understand how their daily work connects to practice performance tend to take more ownership of outcomes. The practices achieving the strongest results are those that combine rigorous measurement with a patient-centered culture, creating an environment where both clinical quality and operational efficiency reinforce each other.
Keeping every appointment slot filled starts with answering every call. Talk to our team about how MyBCAT helps optometry practices capture more patients and reduce revenue leakage.