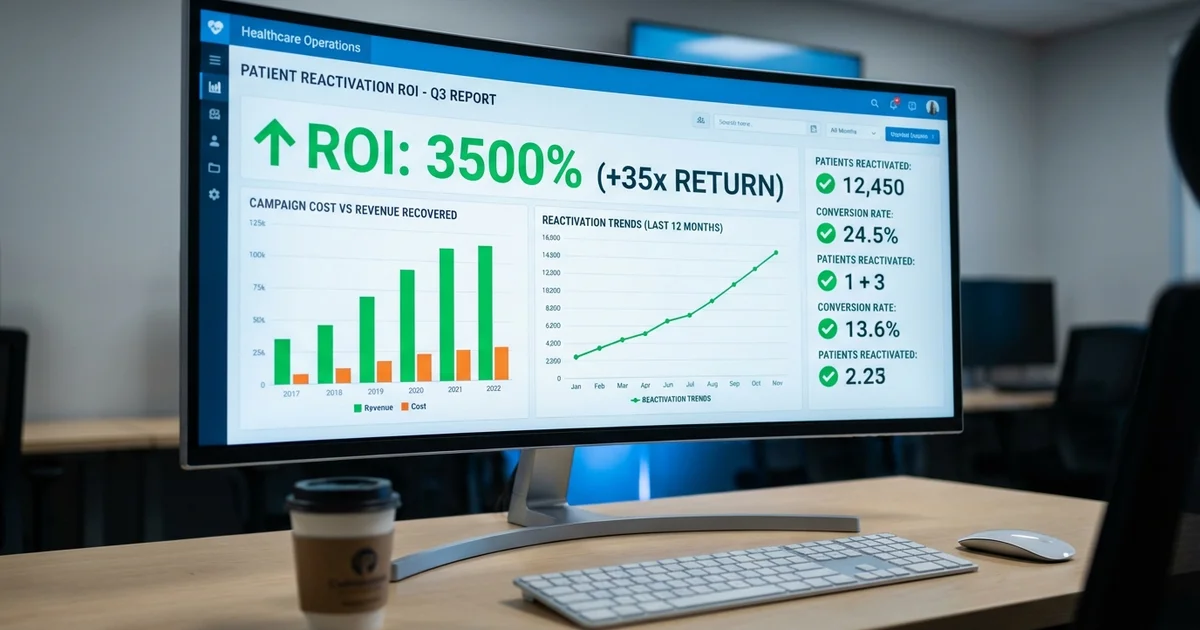
Multi-location healthcare groups recover 15-25% of dormant patients when they follow a structured reactivation playbook. For a 10-location group with 500 dormant patients per site, that translates to 750 to 1,250 recovered patients. At an average patient lifetime value of $3,500, a successful 30-day reactivation campaign generates $2.6 million to $4.4 million in recovered revenue. This playbook provides the exact framework operations leaders use to execute reactivation at scale.
Table of Contents
- What Counts as a Dormant Patient?
- Why Do Multi-Location Groups Need a Different Approach?
- What Is the 30-Day Dormant Patient Reactivation Playbook?
- Which Channel Works Best for Dormant Patients?
- Should You Centralize or Distribute Reactivation?
- What KPIs Should You Track Weekly?
- What Are the Most Common Reactivation Mistakes?
- How Do You Calculate Your Reactivation Opportunity?
- What Technology Do You Need for Scaled Reactivation?
- What Does the Implementation Timeline Look Like?
What Counts as a Dormant Patient?
Dormant patients are those who have not scheduled or completed an appointment within their expected care cycle. The definition varies by specialty:
Specialty-specific dormancy thresholds:
| Specialty | Dormancy Threshold | Typical Care Cycle |
|---|---|---|
| General Dental | 12+ months since last hygiene visit | 6 months |
| Optometry | 18+ months since last exam | 12 months |
| Veterinary | 14+ months since last wellness visit | 12 months |
| Medical Primary Care | 24+ months since last preventive visit | 12-18 months |
According to healthcare retention research, practices lose approximately 10-15% of their active patient base to dormancy annually. For multi-location groups, this compounds across sites, creating a significant revenue gap that grows each month without intervention.
Why Do Multi-Location Groups Need a Different Approach?
Single practices can manage dormant patient outreach informally. Multi-location groups face structural challenges that require systematized reactivation:
Scale complexity: A 20-location dental group with 2,000 active patients per site has approximately 4,000 dormant patients across the network at any given time. Staff turnover means reactivation knowledge walks out the door with each departure. Variable performance creates retention gaps where strong locations subsidize weak ones.
Operational fragmentation: Each location may define “dormant” differently. Outreach happens inconsistently or not at all. No centralized visibility into dormant patient volume or recovery rates.
The solution is a standardized playbook that works across all locations with centralized tracking and accountability.
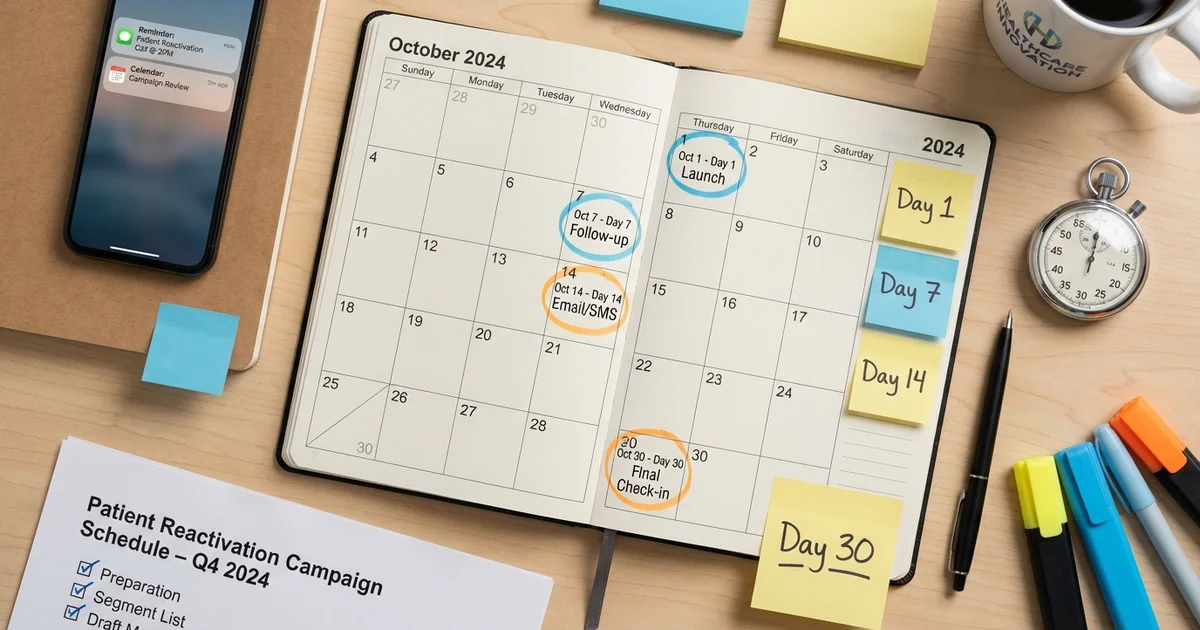
What Is the 30-Day Dormant Patient Reactivation Playbook?
This playbook divides reactivation into four phases, each building on the previous week’s work. The goal is systematic contact across multiple channels with escalating urgency.
Week 1: Data Preparation and Segmentation (Days 1-7)
Before any outreach begins, you need clean data and strategic segmentation.
Day 1-2: Pull and clean the dormant patient list
Extract patients from your PM system who meet your dormancy threshold. For most practices, this means: No completed appointment in the past 12-18 months. Active patient status (not deceased, moved, or explicitly opted out). Valid contact information on file.
Day 3-4: Segment by value and recency
Not all dormant patients deserve equal effort. Create three tiers:
| Tier | Definition | Priority |
|---|---|---|
| High Value | $2,000+ lifetime value, dormant 12-18 months | Highest - personal phone calls |
| Medium Value | $500-2,000 lifetime value, dormant 12-24 months | Medium - phone + text |
| Low Value | Under $500 lifetime value, dormant 24+ months | Lower - automated text/email only |
Day 5-7: Verify contact information
Phone numbers and emails decay at approximately 3% per month. Before launching outreach: Run phone numbers through a validation service. Check email deliverability. Identify patients with no valid contact method for direct mail outreach.
For detailed guidance on prioritizing your outreach list, see our guide on patient recall segmentation.
Week 2: Multi-Channel Outreach Launch (Days 8-14)
Week 2 focuses on initial contact across all channels. The goal is to establish contact, not necessarily to book immediately.
Day 8: Launch SMS campaign to all segments
Text messages achieve the highest response rates for healthcare outreach. According to patient communication research, SMS open rates exceed 95% compared to 20-30% for email.
Sample SMS template:
“Hi [First Name], it’s been a while since your last visit to [Practice Name]. Your [Provider Name] would love to see you back. Reply YES to schedule or call us at [Phone].”
Day 9-10: Follow up with phone calls to Tier 1 (High Value)
High-value patients justify personal outreach. Staff should: Reference specific treatment history when possible. Emphasize any new services or technology since their last visit. Offer convenient scheduling options including extended hours.
Sample phone script:
“Hi [Name], this is [Caller] from [Practice Name]. Dr. [Provider] noticed it’s been over a year since your last visit and wanted me to personally reach out. We’ve added [new service] since you were here last. Do you have a few minutes to find a time that works for you?”
Day 11-12: Email campaign to all segments
Email serves as a supporting channel, not primary outreach. Keep emails short with a single call-to-action.
Day 13-14: Review initial response data
By the end of Week 2, you should see include 10-15% response rate on sms, 30-40% contact rate on phone calls, and 2-5% click-through on email.
Track appointments booked, not just responses. A response without a booking requires follow-up.
Week 3: Follow-Up and Escalation (Days 15-21)
Week 3 increases urgency for non-responders while nurturing those who showed interest but did not book.
Day 15-16: Second SMS to non-responders
Increase urgency without being aggressive:
“Hi [First Name], just checking in again from [Practice Name]. We have openings this week if you’d like to come in. Reply STOP to opt out or YES to schedule.”
Day 17-18: Phone calls to Tier 2 (Medium Value) non-responders
Expand phone outreach to the medium-value tier. These patients may need more convincing but represent significant lifetime value.
Day 19-20: Address common objections
Track the reasons patients give for not scheduling. Common objections include:
- “I’ve been meaning to call” - Schedule them immediately
- “I’m seeing someone else now” - Note as lost, remove from list
- “I don’t have time right now” - Offer a callback in 2-3 weeks
- “I had a bad experience” - Escalate to practice manager for service recovery
Day 21: Mid-campaign review
By the end of Week 3, assess campaign performance:
- Total patients contacted at least once: Target 80%+
- Appointments booked: Target 10-15% of total list
- Appointments completed: Track separately from bookings
For proven scripts that handle common objections, review our patient recall scripts guide.
Week 4: Final Push and Campaign Close (Days 22-30)
Week 4 focuses on converting remaining prospects and closing out the campaign with clean data.
Day 22-24: Final outreach attempt
For patients with no response after multiple attempts:
- One final SMS with clear deadline language
- Direct mail postcard for patients with no valid phone/email
Sample final SMS:
“[First Name], we’ve been trying to reach you about your overdue [appointment type]. Please call us at [Phone] or reply here if you’d like to stay on as a patient. We’re here when you’re ready.”
Day 25-27: Process remaining responses
Late responders often book during the final week. Ensure staff are prepared to handle increased call volume and scheduling requests.
Day 28-30: Campaign wrap-up
Document results and update patient records:
- Mark patients as “reactivated” with appointment date
- Update “unable to reach” status for non-responders
- Flag patients who explicitly declined for removal from future campaigns
- Calculate final conversion rate and revenue recovered
Which Channel Works Best for Dormant Patients?
Different channels perform differently for reactivation versus ongoing recall. Research on patient outreach effectiveness shows:
| Channel | Response Rate | Best Use Case | Cost Per Contact |
|---|---|---|---|
| SMS/Text | 15-25% | Initial outreach, all tiers | $0.02-0.05 |
| Phone Call | 25-40% contact rate | High-value patients | $2-5 per attempt |
| 2-5% click rate | Supporting channel | $0.01 | |
| Direct Mail | 1-3% response | No valid digital contact | $0.50-1.00 |
For a deeper analysis of channel effectiveness, see our comparison of postcard vs text vs phone for patient recall.
Should You Centralize or Distribute Reactivation?
Multi-location groups must decide how to structure reactivation execution.
Distributed model (each location runs its own campaign):
- Pros: Local staff know patients personally
- Cons: Inconsistent execution, no visibility, competes with clinical duties
Centralized model (central team or partner handles outreach):
- Pros: Consistent messaging, economies of scale, dedicated focus
- Cons: Less personal touch for high-value patients
Hybrid model (recommended):
- Centralized team handles Tier 2 and Tier 3 outreach
- Local staff handle Tier 1 (high-value) personal calls
- Central dashboard tracks performance across all locations
For practices considering centralized support, our guide on reactivation call centers for medical practices explains implementation options.
What KPIs Should You Track Weekly?
Operations leaders need visibility into reactivation performance at both campaign and location levels.
Campaign-level KPIs:
| Metric | Target | Calculation |
|---|---|---|
| Contact Rate | 80%+ | Patients reached at least once / Total list |
| Response Rate | 20%+ | Patients who responded / Patients contacted |
| Booking Rate | 15%+ | Appointments booked / Patients contacted |
| Show Rate | 85%+ | Appointments completed / Appointments booked |
| Recovery Rate | 12-20% | Patients reactivated / Total dormant list |
Location-level benchmarks:
Track each location’s performance against the network average. Identify outliers on both ends:
- Top performers: Document what they do differently
- Underperformers: Provide additional training or support
For comprehensive guidance on metrics, see our article on reactivation campaign KPIs.
What Are the Most Common Reactivation Mistakes?
Waiting too long to start: Patients dormant 12-18 months are far more recoverable than those dormant 24+ months. The longer you wait, the lower your recovery rate.
Generic messaging: “It’s time for your checkup” performs worse than personalized messages that reference the specific patient’s history, provider, or last treatment.
Single-channel outreach: Patients who ignore texts may answer calls. Patients who ignore both may respond to email. Multi-channel campaigns consistently outperform single-channel approaches.
No follow-up: One attempt is rarely enough. Patients are busy. A structured follow-up sequence dramatically increases response rates.
Not tracking results: If you cannot measure recovery rate by location, you cannot improve it. Centralized tracking creates accountability.
How Do You Calculate Your Reactivation Opportunity?
Use this formula to estimate the revenue potential of a 30-day reactivation campaign:
Revenue Opportunity = (Dormant Patients) x (Expected Recovery Rate) x (Average Patient Value)
Example for a 15-location dental group:
- Dormant patients: 6,000 (400 per location average)
- Expected recovery rate: 15%
- Average patient value: $3,000
Revenue opportunity: 6,000 x 0.15 x $3,000 = $2.7 million
For detailed ROI calculations, see our guide on patient reactivation ROI.
What Technology Do You Need for Scaled Reactivation?
Running reactivation across multiple locations requires appropriate technology infrastructure:
Essential systems:
- PM/EHR integration to identify dormant patients automatically
- SMS/text platform with HIPAA-compliant messaging
- Call tracking to measure phone outreach effectiveness
- Centralized dashboard for cross-location visibility
Optional enhancements:
- Predictive analytics to prioritize patients most likely to return
- Automated workflow triggers based on last visit date
- Integration with recall systems to prevent future dormancy
What Does the Implementation Timeline Look Like?
For groups launching their first structured reactivation program:
| Phase | Timeline | Activities |
|---|---|---|
| Planning | Week 1-2 | Define dormancy criteria, pull initial lists, train staff |
| Pilot | Week 3-6 | Run 30-day playbook at 2-3 locations |
| Refinement | Week 7-8 | Analyze pilot results, adjust scripts and timing |
| Rollout | Week 9-12 | Deploy to remaining locations |
| Ongoing | Monthly | Run continuous reactivation cycles |
Key Takeaways
Dormant patient reactivation represents one of the highest-ROI activities for multi-location healthcare groups. The key points:
- Define dormancy by specialty (12-18 months for most practices)
- Segment patients by value to prioritize outreach effort
- Use multi-channel outreach: SMS first, phone for high-value, email as support
- Follow the 30-day playbook structure: prepare, launch, escalate, close
- Track KPIs weekly at both campaign and location levels
- Expect 15-20% recovery rates with proper execution
The difference between groups that recover dormant patients and those that do not is simply execution discipline. This playbook provides the structure. The results depend on consistent follow-through. For healthcare groups with 3+ locations, our multi-location recall solution provides centralized reactivation support.
Reactivating dormant patients is one of the highest-ROI investments a practice can make. Talk to our team about how MyBCAT combines call answering with patient recall to keep your schedule full.