
When a healthcare organization expands beyond a handful of locations, the front desk becomes one of the most critical operational control points, and one of the hardest to manage consistently. What works at a single site often breaks down when replicated across a network, creating variance that affects everything from patient experience to revenue capture.
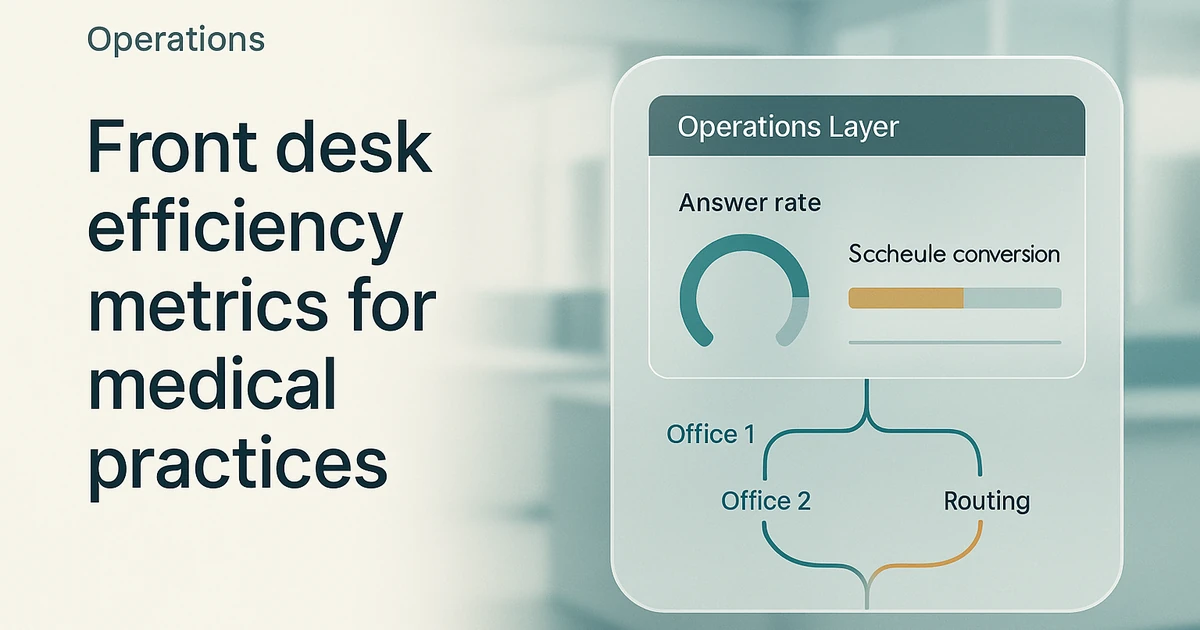
For COOs and VPs of Operations at multi-location healthcare groups, front desk efficiency metrics provide the visibility needed to standardize performance, identify underperforming sites, and build the operational infrastructure that supports continued growth. This article examines the core metrics that matter for enterprise healthcare operations, how to collect and centralize this data across your network, and what an implementation roadmap looks like for groups managing multiple locations.
Why Front Desk Metrics Matter for Multi-Location Healthcare Groups
The front desk is where patient acquisition converts to revenue, or fails to. Across a network of locations, small inefficiencies compound into material financial and operational gaps. Understanding why these metrics matter at scale is the first step toward building an effective measurement program.
When each location operates with its own interpretation of front desk procedures, variance becomes unavoidable. One site might prioritize patient flow speed while another emphasizes thorough data collection. Neither approach is inherently wrong, but inconsistency across locations makes it nearly impossible to identify best practices, benchmark performance, or deploy targeted improvements. Multi-location groups that lack standardized front desk metrics often discover significant performance differences only when problems surface through missed revenue targets, patient complaints, or staffing issues. By then, the operational debt has accumulated to the point where remediation requires substantial investment. According to MGMA foundational benchmarks guidance, tracking core KPIs like scheduling efficiency, no-shows, patient flow, and registration accuracy supports stronger operational performance across practice networks.
This compounding effect becomes increasingly problematic at scale. A registration accuracy issue at a single location might affect a manageable number of claims, but the same issue replicated across a network creates a systemic revenue leak that becomes increasingly difficult to trace and correct. Groups with limited visibility into site-level front desk performance often find that what appears to be a billing department problem actually originates at patient intake. The compounding effect extends to staffing and training as well, since without standardized metrics, each location develops its own informal benchmarks and expectations. When staff transfer between sites or when the organization attempts to implement new protocols, these informal standards create friction and slow adoption. Building a centralized scheduling operation requires consistent baseline metrics across all participating locations.
Front desk efficiency directly affects multiple revenue cycle touchpoints as well. Registration accuracy determines whether claims contain the correct patient and insurance information. Eligibility verification affects denial rates. Point-of-service collections influence overall collections performance and reduce back-end AR effort. A peer-reviewed simulation study published in the National Library of Medicine demonstrates that small variations in patient arrival patterns and scheduling discipline can multiply into significant wait time differences, affecting throughput and patient satisfaction. For operations leaders at PE-backed groups or DSOs, these metrics often surface in due diligence and ongoing board reporting. Having standardized KPI definitions and consistent measurement across locations demonstrates operational maturity and reduces integration risk for future acquisitions.
Core Front Desk KPIs Every Operations Leader Should Track
While the specific metrics that matter will vary by specialty and organizational priorities, several categories of front desk KPIs provide consistent value across healthcare verticals. These metrics balance leading indicators that predict future performance with lagging indicators that confirm outcomes.
Registration accuracy measures the percentage of patient records that contain complete, correct demographic and insurance information at the time of service. Errors introduced during registration propagate through the revenue cycle, generating claim denials, patient confusion, and rework for billing staff. MGMA foundational benchmarks cite registration accuracy targets of 95% or higher for well-performing practices. Achieving this level of accuracy requires clear protocols, adequate training, and technology that supports real-time validation. For multi-location groups, the challenge is ensuring that every site follows the same registration workflow and that deviations are identified quickly through KPI dashboard visibility.
Closely related to registration accuracy is eligibility verification, which measures the percentage of patients whose insurance coverage is confirmed before their appointment. Pre-visit verification allows staff to address coverage gaps proactively, set appropriate patient expectations for financial responsibility, and reduce day-of-service surprises that delay check-in. MGMA benchmarks suggest that groups aim for pre-visit eligibility verification rates in the range of 80% to 90%, depending on appointment volume and payer mix complexity. The ADA’s Administrative Efficiencies Initiative addresses the burden of eligibility verification as a key focal point for front office workflow improvement across practice types.
Point-of-service collections represent the third critical metric category, referring to patient payments collected at the time of service including copays, deductibles, and outstanding balances. Strong POS collections performance reduces accounts receivable aging, decreases collection costs, and improves cash flow predictability. MGMA front desk benchmarking guidance identifies POS collections targets in the range of 70% to 80% of expected patient financial responsibility. Achieving this requires clear financial policies, staff confidence in discussing payment, and technology that provides accurate patient balance information at check-in. Multi-location groups often benefit from standardized collections scripts and training across sites.
How Multi-Location Groups Should Collect and Centralize Front Desk Data
Having defined the metrics that matter, the next challenge is collecting this data consistently across locations and aggregating it in a way that enables meaningful comparison and action.
A unified reporting framework establishes common definitions, calculation methodologies, and reporting cadences for front desk metrics across all locations. Without this framework, site-level data often cannot be meaningfully compared since one location might calculate registration accuracy based on all encounters while another excludes certain visit types. The framework should specify data sources (typically the practice management system and EHR), extraction frequency, calculation formulas, and reporting hierarchies. Most multi-location groups benefit from a centralized analytics function or platform that aggregates site-level data and produces standardized reports for operations leadership. This capability is foundational for groups building toward DSO-style operational benchmarks.
Definition consistency is often more challenging than data extraction and deserves careful attention during framework development. Terms like “no-show rate” might mean different things at different locations. Does it include same-day cancellations? Late arrivals who were rescheduled? Patients who arrived but left before being seen? The ADA guidance on practice KPIs notes that cancellation and no-show rates should target 5% or less, but achieving that target requires first agreeing on what counts. Multi-location groups should document metric definitions in an operational playbook that all locations reference. This documentation becomes especially valuable during acquisitions, when integrating a new location into the existing measurement framework.
The Role of Staff Training in Metric Performance
Metrics are outcomes of behavior. Improving front desk efficiency metrics requires changing how front desk staff work, which means training, coaching, and ongoing performance management.
Standardized protocols translate metric targets into specific workflows and scripts. If the organization wants to improve eligibility verification rates, staff need clear procedures for when to verify, how to handle exceptions, and what to do when verification fails. The American Academy of Ophthalmology’s guidance on office flow emphasizes that tracking patient flow provides information about efficiency at each stage of the visit. This principle applies to front desk operations as well, since breaking down the check-in process into discrete steps allows identification of bottlenecks and targeted training interventions.
The connection between training investment and KPI outcomes reinforces the importance of this approach. The American Optometric Association notes that operational efficiency improvements for optometry practices often include staff training programs and workflow optimization for front desk operations. Many multi-location groups observe a positive relationship between training investment and front desk KPI performance, though the specific relationship varies by organization. Multi-location groups that take staffing optimization seriously typically establish a central training function that develops materials, delivers initial onboarding, and provides ongoing skill development. Site-level managers then reinforce training through coaching and performance conversations tied to specific metrics.
How Technology Enables Visibility Across Your Practice Network
Technology serves as the connective tissue that makes centralized front desk metrics possible. The right technology stack enables real-time visibility, automated alerting, and data-driven decision making at both the site and network level.
Most front desk metrics originate in the practice management system or electronic health record, and multi-location groups often operate with a heterogeneous technology environment. Different locations may use different systems, especially if growth has occurred through acquisition. Data integration becomes a critical capability in these environments. Groups need either a common data platform that normalizes information from multiple source systems or a standardization strategy that migrates all locations to a common platform. The former provides faster time to value while the latter provides cleaner long-term operations but requires significant change management. Groups pursuing integration should review guidance on EHR and PMS integration for centralized scheduling.
Dashboards transform raw data into actionable visibility and represent a key capability for operations leaders. Effective front desk dashboards for multi-location groups typically include network-level aggregates, site-level detail views, trend visualization, and exception alerting. The key is balancing detail with usability. Operations leaders need enough information to understand performance drivers without drowning in metrics that obscure rather than illuminate. Most successful implementations start with a focused set of core metrics and expand over time based on demonstrated need. Building this capability supports the broader goal of healthcare group operations benchmarking.
Implementation Roadmap for a Growing Group
Moving from ad hoc front desk management to systematic measurement requires a phased approach that builds capability while delivering early wins.
The first phase establishes current state visibility and confirms which metrics the organization will prioritize. This typically involves pulling historical data from each location’s systems, normalizing that data using working definitions, and identifying the variance between sites. This baseline assessment often reveals gaps in data availability or quality that need to be addressed before ongoing measurement is feasible. The output of this phase is a prioritized set of metrics with clear definitions, target ranges, and identified data sources.
Before deploying measurement and improvement programs network-wide, most organizations benefit from piloting at a subset of locations. The pilot validates that data collection processes work as intended, that definitions produce meaningful comparisons, and that staff understand how they will be evaluated. The pilot phase is also an opportunity to calibrate targets. Initial benchmarks drawn from industry sources may need adjustment based on the organization’s specific context, since payer mix, patient population, specialty focus, and operational constraints all affect what is achievable.
With validated processes and calibrated targets, the organization can deploy front desk metrics measurement across all locations. This rollout should include communication that explains the program’s purpose, training that ensures staff understand expectations, and technology deployment that makes metrics visible to those who need them. Measurement is not the end state but rather the foundation for continuous improvement. Operations teams should establish regular review cadences where performance is discussed, outliers are investigated, and improvement initiatives are prioritized. Over time, the organization develops institutional knowledge about what drives front desk efficiency and how to sustain high performance across the network.
Related Reading
For additional context on building operational infrastructure across multi-location healthcare groups, see our related articles on DSO Call Center KPI Benchmarks for Enterprise Healthcare, Healthcare Group Operations Benchmarks, Centralized Scheduling for Multi-Office Groups, KPI Dashboard for Multi-Location Intake, and Enterprise Healthcare Staffing Ratios and Patient Access Optimization.
Sources
- MGMA - Foundational Benchmarks and KPIs for Medical Practice Operations
- MGMA - Top KPIs Physician Practices Should be Monitoring
- ADA - Key Performance Indicators
- ADA - Optimize Dental Practice Administration and Efficiencies
- AAO - Boost Practice Efficiency: How to Improve Office Flow
- AOA - Practice Changes Can Increase Office Efficiency
- NIH/PMC - Small Changes in Patient Arrival and Consultation Times Have Large Effects on Patients’ Waiting Times
Managing front desk efficiency across 3+ locations? Request an Enterprise Assessment for your multi-location group.